Cloudflare routes via anycast to your nearest edge. Choosing a city relabels the target; the edge actually measured is shown live and in the log.
Cruise: a light steady stream with periodic full-speed bursts. Burn: saturates the link continuously.
The test ends automatically and shows a downloadable report.
Stops the test early if total data used reaches this limit — useful for Burn on metered connections.
Burn usage scales with your connection speed, so it is shown as a range.
The probe service (Phase 2) unlocks authoritative-nameserver, glue, EDNS and multi-region propagation tests. The resolver probe host needs a wildcard record to measure your own resolver's cold-lookup latency.
When a test completes, one anonymous summary joins the fleet dataset — region-level location only, IP never stored (one-way keyed hash). Turn this off and nothing is sent at all. See Help → Cookies & Privacy for the full picture.
Cold = a forced cache-miss lookup through your own resolver via a unique probe host.
Validated (AD flag), DS at registry, and DNSKEY in the zone.
Agreement of the A-record answer across reachable resolvers. Divergence can mean GeoDNS, filtering or hijack.
Every completed test contributes one anonymous record — region-level location only, no IP stored, sources grouped by a one-way keyed hash. Opt out any time in Settings. Here's what the whole fleet is seeing.
This checks how your connection looks from the public internet and which inbound ports are reachable from outside. It probes only your own connection (the address our server sees you arrive from); it can't be pointed anywhere else. Note: testing behind a VPN or CGNAT probes that gateway — not your own router — so it will not reveal what ports are open on YOUR router and is of limited use. Drop the VPN to test your real connection.

A live subnet scanner for Windows. Type a range, get one row per address with everything the network will admit about what is sitting there — and, in the connected build, an agent that notices the moment something new joins and emails you about it.
GET LANIPEDE ›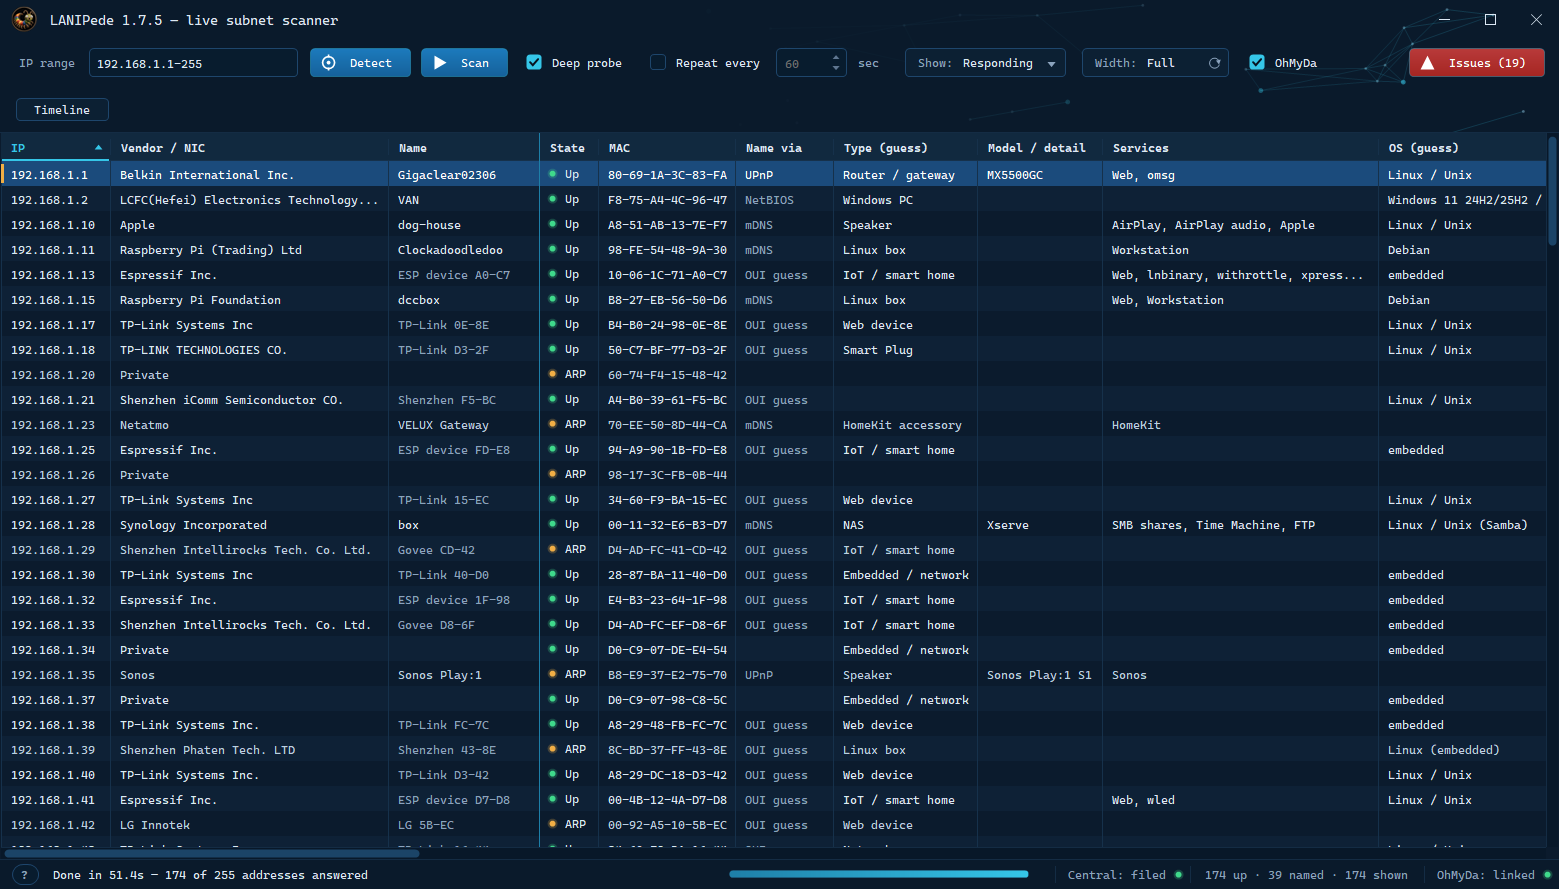
WHAT IT FINDS
| Source | What it gives |
|---|---|
| ICMP ping | reachability, round-trip time, TTL (and so a rough OS family) |
| ARP | the MAC address — and the devices that ignore ping but still answer at layer 2 |
| IEEE OUI database | the NIC manufacturer, mapped to the brand you'd recognise |
| mDNS / NetBIOS / DNS | the name Apple kit, Android, printers, IoT and Windows machines announce |
| SSDP / UPnP | friendly name, manufacturer and model — usually the richest answer |
| mDNS browse | what each device says it can do — AirPlay, HomeKit, printing, SMB |
| DHCP probe | who is handing out addresses, and whether more than one is |
| UPnP (IGD) | what the router has opened to the internet, and the public address |
| SNMP, SMB, banners (deep) | exact model and firmware, the exact Windows build behind a share, SSH/FTP greetings |
| TCP ports, HTTP / TLS (deep) | ~35 well-known ports, the Server: header, page title, certificate name |
| OhMyDa (optional) | which AP or switch port, SSID and RSSI, from an Omada controller |
Every scan is live; nothing is carried over from the last one. Ping alone under-reports badly — anything behind Windows Firewall, and a great deal of IoT, ignores ICMP but still answers ARP, so LANIPede sweeps both and unions the result. On a typical home network that is the difference between finding 110 devices and finding 145.
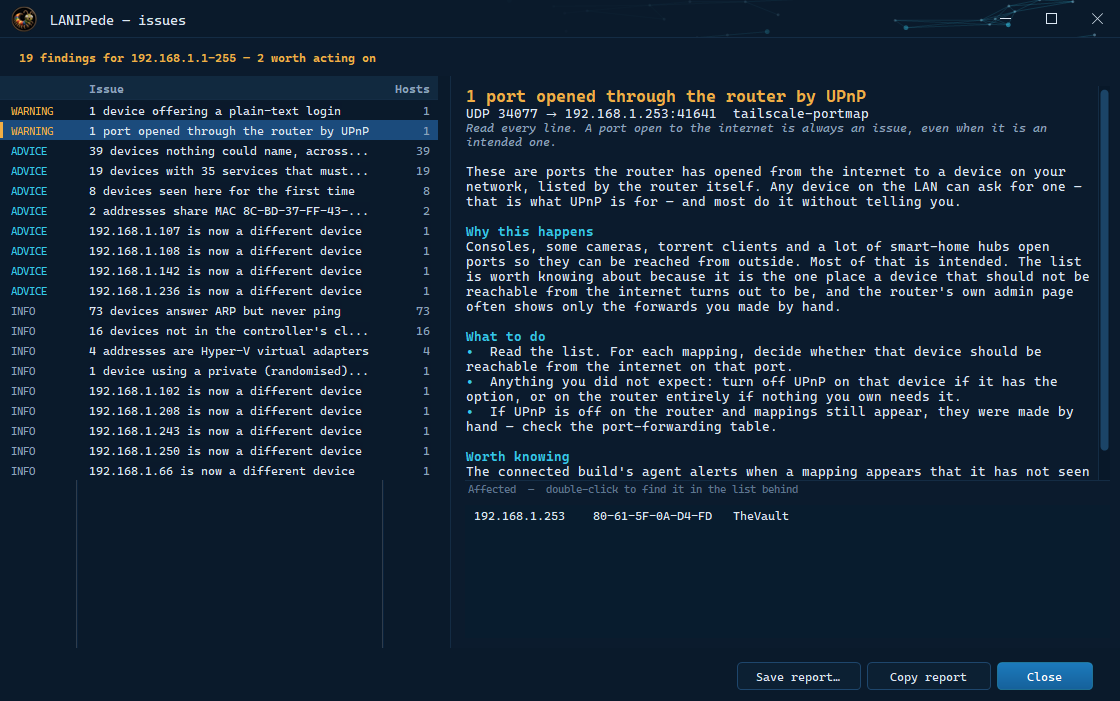
ISSUES, EXPLAINED
The Issues button collects everything the scan found worth explaining, each with a write-up: what it means, why it happens, and what to do — which is sometimes, legitimately, nothing. Findings are classified by evidence, not by pattern: three addresses sharing a MAC is normal when all three answer ping and worth investigating when none of them do, and the write-up says which you are looking at. Shared MACs, an address that has changed hands, devices seen for the first time, randomised MACs, hypervisor adapters, a second DHCP server, ports opened through the router by UPnP, services that must never reach the internet, devices answering SNMP to "public".
CONNECTED, OR NOT
At install time LANIPede asks whether this machine keeps its history to itself or files it centrally. Standalone is the app as described above: scans on demand, a ledger of its own, nothing listening, nothing sent anywhere. Connected adds three things, and the choice can be changed later without reinstalling.
One SQLite file, encrypted at rest, holding one row per device kept up to date plus an entry for every field that has ever changed on it. The app on any machine on the network files with it and reads from it; a browser can see its status page; the Timeline shows every change over a day, a week, a month or three.
A tray app beside the store. It reads the ARP cache every half minute and sweeps the subnet properly once an hour — and it holds the DHCP port, so every device that asks for an address is heard the second it joins, with its own hostname, its DHCP client and an OS fingerprint. An unfamiliar one is probed there and then, and the alert leaves within seconds. What counts as "new" is a judgement rather than a lookup, because a phone with a private Wi-Fi address re-rolls its MAC; four policies in the agent's settings decide how strict to be.
Optionally, through Resend: a device that has never been here gets its own email within the minute; everything less certain waits for a summary on whatever interval you set. Every alert says whether it is a habit — "Seen 6 times since 14/09/2026 — daily, around 03:10 (±30 min). This looks like regular behaviour." — and a habit can be told to wait for the summary, while one that breaks its pattern still arrives at once.
GET LANIPEDE
I'm giving you this free software and all I ask in return is an email address, which will be immediately deleted. I just track rough locations.
Type your address and a download link arrives by email within a minute. The link is signed and works for 48 hours; the address is handed to the mail service once and kept nowhere — not in a list, not in a log. What Relay99 records is the region the request came from and the time, the same location marker the Observatory keeps, and that is what the count above is made of.
Windows 10 or 11, 64-bit. The installer is self-contained, so there is nothing else to install. Standalone, or connected with the agent, is chosen on the install page and can be changed later.
LANIPede is an unsigned exe that Windows will probably block. It costs £100 for a signing certificate and I just don't have that right now. You can trust me though, I'm British ;-)
When SmartScreen objects, it is More info → Run anyway. The installer and the app are the same files on every download, and the email carries the exact size.
Relay99 is a continuous internet observatory: instead of a ten-second speed test, it watches your connection over minutes or hours and catches the faults that only show up when nobody's looking. This manual explains what each instrument does, when to reach for it, and — most importantly — how to read what it tells you.
LIVE MONITOR
The main instrument. It streams real data between your browser and Cloudflare's edge network continuously, sampling throughput every 100 milliseconds and firing a tiny latency probe every second. A one-off speed test answers "how fast is my line right now?" — the Live Monitor answers a harder and more useful question: "what does my connection do over time, and does it ever fail?" Intermittent faults — the video call that drops twice an evening, the game that rubber-bands every few minutes — are invisible to one-shot tests, because the odds of a ten-second test overlapping a ten-second fault are terrible. Run the monitor for 15 minutes or 24 hours and the fault has nowhere to hide.
To prove (or disprove) an intermittent problem; to measure sustained real-world speed rather than a burst; to watch stability while you change something (move the router, switch Wi-Fi channel, toggle a setting); to collect evidence an ISP can't wave away.
- Pick a duration and intensity in Settings (or just press START — 15 minutes of CRUISE is the default).
- Leave it running. Use your connection normally, or don't — both are informative.
- PAUSE freezes the test; STOP ends it. Pressing START after a stop clears the last run and begins fresh.
- When the timer completes you get a report you can download.
Download / Upload cards. What flowed in the last instant, with totals underneath. Important: in CRUISE mode the monitor deliberately trickles (a light ~4 Mbps stream) and only opens the throttle for a ~12-second burst every three minutes — so the cruise average is not your line speed; the peak is much closer. FULL BURN saturates continuously, so its average is your sustained line rate.
Latency & jitter. Latency is the round trip to the edge; the minimum is the physics-and-infrastructure floor of your connection (fibre typically sits under ~10 ms to a nearby edge, cable/VDSL 10–25 ms, 4G/5G and satellite higher). Jitter is how much that wobbles — the number that actually predicts choppy calls. On a healthy wired path, jitter stays below roughly 15% of latency; jitter approaching or exceeding latency means queueing or radio interference close to you.
Packet loss. Counted on the once-per-second probe stream. Zero is normal. A few hundredths of a percent is noise; sustained loss of 1%+ degrades everything and points at an impaired line or chronic congestion.
Connection stability. A rolling per-second score summarised as a percentage and a verdict (99.5%+ EXCEPTIONAL, 98%+ GOOD, 95%+ FAIR, below that DEGRADED). It is driven mostly by probe loss and latency spikes — which means a collapsed download with clean probes barely dents it. That's deliberate honesty, not a bug: dropouts are counted and reported separately, and the report will tell you when the headline number understates the story.
Throughput chart. The whole test at a glance. FULL shows the entire planned duration; 15M/10M/5M/1M zoom to a trailing window. Red dashed verticals mark the exact moment each dropout was detected — if they line up evenly, that regularity is itself a diagnosis (see Dropouts below).
The observatory log. The plain-English narration: test started, bursts, dropouts with probe results, report ready. When something odd happens, the log is the first place to look.
DROPOUTS & THE PROBE BATTERY
"The internet dropped" almost never means everything died. Usually one layer failed — the Wi-Fi radio, the DNS resolver, one route, or just the single TCP flow carrying your download — while everything else kept working. The difference matters enormously, because each failure pattern has a different culprit and a different fix. Relay99's answer is the probe battery: the instant sustained throughput collapses against its recent baseline, the monitor fires seven independent probes at every network layer it can reach — while the hole is still open — and records which survived.
The seven probes: EDGE RTT (the existing warm connection — is the path itself alive?) · NEW TCP+TLS (can a brand-new connection be established?) · CDN PATH (a second, independent provider — is it just one network?) · DoH GOOGLE and DoH CLOUDFLARE (encrypted DNS, two providers) · YOUR RESOLVER (a forced cold lookup through your own DNS) · UPLOAD LANE (does sending still work?).
The pattern of survivors is a fingerprint. It converts "it broke again" into "this specific layer broke while these five didn't" — which is the difference between guessing and diagnosing.
- Nothing — it's automatic. Every dropout is logged, marked on the chart, and dissected in the results.
All probes green is the most counter-intuitive and most common pattern: the link never dropped — something killed your specific transfer flow while letting everything new through. That points at per-flow state on the path (router NAT/flow-offload tables, an ISP traffic shaper, carrier-grade NAT), not at your line. All probes red is a genuine link-level outage: line, modem, or radio. DNS-only failures implicate resolvers, not connectivity. New-connections-fail while the warm connection survives is the classic full NAT table. Upload-only failures point at upstream impairment (on cable, the modem's upstream RF).
Spacing is evidence too. Random congestion doesn't keep time. Dropouts recurring on a tight interval mean a timed process: ~60 s intervals smell of Wi-Fi background scans, the five-minute family belongs to NAT/CGNAT table sweeps and short DHCP renewals, and hourly patterns match PPPoE/session re-authentication. The report does this matching for you.
One honest caveat: in CRUISE mode a dropout that opens right after a line-rate burst can show an inflated duration (the detector waits for a recovery threshold the light cruise stream can't reach until the next burst). The report flags exactly which durations to read as upper bounds.
REPORTS & ROOT-CAUSE ANALYSIS
Every completed (or stopped) test produces a report card — downloadable as a PNG image, an SVG, or, most usefully, a self-contained HTML file. The HTML report carries everything: the headline numbers, the full throughput chart with dropout markers, the complete forensics list for every dropout, and a rule-based root-cause analysis written by a network-engineering rule engine that reasons only from this test's measurements — which layers died together, how events were spaced, what the instrument itself was doing at the time.
To get a ranked list of likely causes with concrete fix instructions instead of a folklore checklist; to hand your ISP evidence with timestamps they can check against their own logs; to keep before/after proof when you change something.
- Let a test finish (or STOP it) — the TEST COMPLETE panel appears.
- Press DOWNLOAD HTML for the full report; PNG/SVG for a shareable card.
- Open the HTML file in any browser — it works offline and prints cleanly.
Findings are tagged: FINDING (something wrong, earned by the data), OBSERVATION (context), INSTRUMENT NOTE (the engine correcting for its own artifacts or critiquing its own headline verdict — when the tool might mislead you, it says so). Ranked causes carry a percentage that is relative evidence weight among the candidates, not absolute certainty — 56% doesn't mean "56% chance", it means "over half the evidence points here". Each cause lists evidence for (▲) and against (▽), and ships a numbered HOW TO FIX IT plan with the exact router menu names, numbers computed from your own measurements, and word-for-word scripts for ISP calls.
The DISCRIMINATING TESTS are the most valuable part. Each one is chosen because its outcome splits the top candidates — run them in order and you converge on the true cause in one or two tests instead of thrashing through settings.
TEST SETTINGS
Four decisions shape a test: endpoint (leave on Automatic to use the nearest Cloudflare edge — choosing a distant one measures the internet between, which is occasionally exactly what you want), duration (1 minute to 24 hours), intensity, and an optional data cap.
CRUISE is the observatory mode: a light steady stream (~4 Mbps) with a line-rate burst every three minutes to refresh the peak reading. It's designed to run all day without eating your allowance or your bandwidth — think of it as leaving a seismograph running. FULL BURN saturates the line continuously with parallel streams: it measures true sustained throughput and exposes load-dependent faults (bufferbloat, overheating hardware, shapers that punish sustained flows) that cruise is too polite to trigger. Burn is also the honest test of "what happens to my latency while I'm actually downloading?"
- Hunting an intermittent fault? CRUISE, long duration (2–24 h), covering the time of day it bites.
- Measuring speed or diagnosing under-load problems? FULL BURN, 15 minutes.
- On a metered connection? Set a DATA CAP — the test stops itself at the limit.
Burn moves data at line rate for the whole duration: on a 500 Mbps line that's roughly 3.7 GB per minute, over 5 TB if you left it running 24 hours. The estimate panel in Settings does this arithmetic for your line before you commit; a 24-hour burn is almost never what you want — that's what cruise is for.
NAME SERVERS (ROUTE99)
An audit of a domain's DNS infrastructure, run from your browser. Where the DNS Test (below) asks "which resolver should I use?", Route99 asks "is this domain's DNS healthy?" — the question that matters when you own or manage a domain, or when one particular site misbehaves. It measures resolver response for the domain (including a forced cache-miss "cold" lookup through your own resolver), checks DNSSEC end-to-end (validation flag, DS record at the registry, DNSKEY in the zone), polls a panel of public resolvers for consensus on the answer, walks the delegation chain (root → TLD → authoritative nameserver → address), and lists the domain's records.
After changing DNS records or nameservers (did it propagate? is the delegation intact?); to verify DNSSEC actually validates; when a site works on one network but not another (consensus reveals split or filtered answers); to see TTLs before planning a migration.
- Type a domain (default: relay99.com) and press RUN AUDIT.
- START MONITOR re-runs the audit on an interval — useful while waiting for a change to propagate.
Resolver speed: the cold number is the honest one — it's a lookup nobody has cached, the cost a first-time visitor pays. Warm lookups mostly measure your resolver's cache. DNSSEC: a closed lock means responses are cryptographically validated end-to-end; an open lock usually means the zone simply isn't signed — extremely common, not an emergency, but unsigned zones have no tamper-proofing. A broken chain (signed but failing validation) is serious: some resolvers will refuse to resolve the domain at all. Consensus: all resolvers agreeing is the healthy norm. Divergence has two readings — a CDN serving different addresses per region (fine, by design) or a resolver being filtered/hijacked (bad). If the odd answer out comes only from your own resolver, be suspicious of it, not the domain. Delegation: each hop must agree; TTLs tell you how long stale answers can linger after a change.
DNS TEST (RESOLVER BENCHMARK)
Every website visit starts with a DNS lookup, and that lookup goes to whichever resolver your device or router is configured to use. This test races ~20 public DNS-over-HTTPS resolvers from your browser, over your connection — which is the only measurement that matters, because anycast routing means the "fastest resolver" is different in London than in Lagos. Each resolver answers a mix of cached and deliberately-uncached queries; the ranking is built on the median (typical feel) and P95 (the bad moments — one slow lookup in twenty is what you actually notice).
Snappier browsing (resolver latency fronts every new connection); choosing a security- or family-filtering resolver with known cost; checking whether your ISP's default resolver is holding you back — the test highlights your current resolver in the ranking.
- Pick a mode — QUICK for a fast look, STANDARD normally, THOROUGH for a decision.
- Choose whether filtered resolvers join the ranking, then START.
- Tap any row for that resolver's full timing detail.
Prefer consistency over the best headline: a resolver with median 12 ms / P95 18 ms beats one with median 9 ms / P95 90 ms in real use. Verified vs latency-only: solid chips are resolvers whose answers the test can cryptographically verify; dashed ones can only be timed — their numbers are real but treat them as timing-only. Don't switch on one run. Resolver performance shifts with time of day and network load — run the test a few times across a day or two before committing, then set the winner in your router's DNS settings (the HTML report's fix plans include the how-to). Filtering resolvers trade a little latency for protection; the ranking shows exactly how much you're paying.
OBSERVATORY
The fleet view: every completed Relay99 test anywhere contributes one anonymous record, and this page charts the aggregate — ratings, download/latency/stability distributions, most-tested endpoints, regional averages, and fleet-wide dropout statistics. Privacy is engineered in, not promised: the record is built server-side from region-level location only (no city), the IP address is never stored — it's converted to a one-way keyed hash so repeat sources can be counted but never identified — and the throughput history stays on your device.
Context. "Is 40 ms latency normal?" and "is everyone's Thursday evening this bad, or just mine?" are questions a single test can't answer. Comparing your report against the fleet's distributions tells you whether you're an outlier worth investigating.
- Nothing to configure — contribution is automatic when a test completes.
- Browse the charts; REFRESH pulls the latest aggregate.
The distributions are the useful part: find your own result's bucket in the download, latency and stability histograms — being in the worst bucket while your neighbours cluster higher is a signal your line, not the internet, deserves attention. The dropout panel shows what fraction of all tests catch dropouts and how many show the regular timed-process signature. Small-sample honesty: while the fleet is young, a handful of tests can swing the charts — read counts before conclusions.
COOKIES & PRIVACY (GDPR)
Relay99 uses exactly two cookies, and both are boring on purpose:
| Cookie | Contents | Lifetime | Purpose |
|---|---|---|---|
| relay99_settings | Your test configuration (endpoint, duration, mode, data cap, Route99 fields) | 365 days | Remember your settings |
| relay99_introSeen | "1" | 365 days | Don't re-show the intro |
Both are first-party and contain no identifier of any kind — no user ID, no session token, nothing unique to you. There is no localStorage, no analytics, no ad-tech, no fingerprinting, and zero third-party cookies. Pure preference cookies like these fall under the ePrivacy "strictly necessary for the service you asked for" family — which is why there's no cookie banner: there is nothing to consent to.
Measurement traffic. Running a test necessarily sends data between your IP and the test endpoint (Cloudflare's edge), and the DNS benchmark, by its nature, contacts the resolver operators being raced — that is the service you explicitly requested. Hosting is served by Bunny.net (an EU company).
The Observatory record. When a test completes, one anonymous summary is contributed to the fleet dataset. Your IP address is never stored: the server keeps region-level location only (no city) and converts the IP into a one-way keyed hash so repeat sources can be counted but not identified. Full precision: under GDPR's strict definitions a keyed hash is pseudonymisation rather than anonymisation — which is why the rest of the record is minimised to nothing but test metrics.
Fonts. The Space Mono typeface is self-hosted on relay99.com — no third-party font requests, no IP shared with any font provider. The downloadable HTML report references the same relay99-hosted stylesheet and falls back to your system's monospace when opened offline.
LANIPede downloads. I'm giving you this free software and all I ask in return is an email address, which will be immediately deleted. I just track rough locations. In practice: the address you type is handed to the mail service (Resend) once, to send you the signed download link, and is not written to storage, to a log, or to the record — there is no list and nothing to unsubscribe from. The record kept is the same region-level location marker the Observatory uses (country and region, from the CDN's own headers) plus the time, and that is all the download count on the LANIPede page is made of. The link itself expires after 48 hours.
Cookie-wise: fully compliant, banner-free by design. Data-wise: engineered for minimisation first — nothing is collected that the charts on the Observatory page don't visibly use, and nothing identifying is stored at all. This section is an engineer's transparency statement rather than formal legal advice; if you want zero contribution to the fleet dataset, switch it off under Settings → OBSERVATORY — with the toggle off, nothing is sent at all.
Find the fastest secure DNS resolver from your connection.
Relay99 measures real DNS-over-HTTPS response times from your browser and compares speed, consistency and reliability.
—
Unfiltered resolvers are always tested. Family-filtering is ranked separately and only when enabled. Latency-only resolvers are timed but their answers can't be verified ().
This test measures encrypted DNS-over-HTTPS from your browser. Browser security prevents it from directly measuring your router or operating system's current DNS resolver.
Don't switch your DNS on the strength of a single test — results vary over time and at different times of day. Run it a few times before deciding.
A quicker DNS response does not always mean a website will load more quickly. Some sites use the resolver's network location when choosing a CDN server, so a slightly slower resolver may occasionally return a better content route.